Advanced Monitoring
Onehouse offers advanced monitoring that provides rich metrics about your deployment by exposing a prometheus server and pre-built Grafana dashboards within your cloud environment.
This guide walks through the advanced monitoring metrics and how to access them.
Get Access to Advanced Monitoring
Monitoring credentials are automatically provisioned for your project. You can find your Grafana and Prometheus URLs in the product UI under Settings → Dataplane Settings → Monitoring section.
Advanced monitoring is served from your project's main load balancer, which runs inside your own cloud environment. There are two ways to reach it, and they do not expose the same things:
| Access mode | How you reach it | What is exposed |
|---|---|---|
| From within your VPC (default) | Over a VPN or bastion host, or with the kubectl port-forward command shown in the Monitoring section — follow these steps | Prometheus and Grafana |
| Public access (opt-in) | Directly over the internet at https://dp-apps.cloud.onehouse.ai/, after authenticating with your Onehouse account | Grafana only — Prometheus is not exposed |
By default the main load balancer is internal, and is only reachable from within your VPC. While public access is disabled, the Monitoring section displays a kubectl port-forward command you can run locally to reach it.
A Project Admin can turn on Public Access to Main Load Balancer in the project settings. With it enabled, the Grafana URL in the Monitoring section becomes directly clickable, project members can reach Grafana and the Spark UIs from any network, and those URLs start with https://dp-apps.cloud.onehouse.ai/.
The exact public hostname depends on where your project is hosted, so use the URL shown in the Onehouse console rather than assuming dp-apps.cloud.onehouse.ai.
Public access deliberately exposes Grafana and the Spark UIs, but not the Prometheus server. Requests to the Prometheus path over the public URL are rejected. To reach Prometheus — including to use it as a datasource for your own Grafana — connect from within your VPC using the internal load balancer steps.
Advanced monitoring is a pull model: you query the Prometheus server that runs in your data plane. If you would rather have Onehouse push metrics to a tool you already run — Grafana Cloud, Datadog, or Honeycomb — see Forward Telemetry to Your Own Tools. That path sends metrics over OTLP directly from your data plane to the vendor, and needs no load balancer access at all.
Prometheus
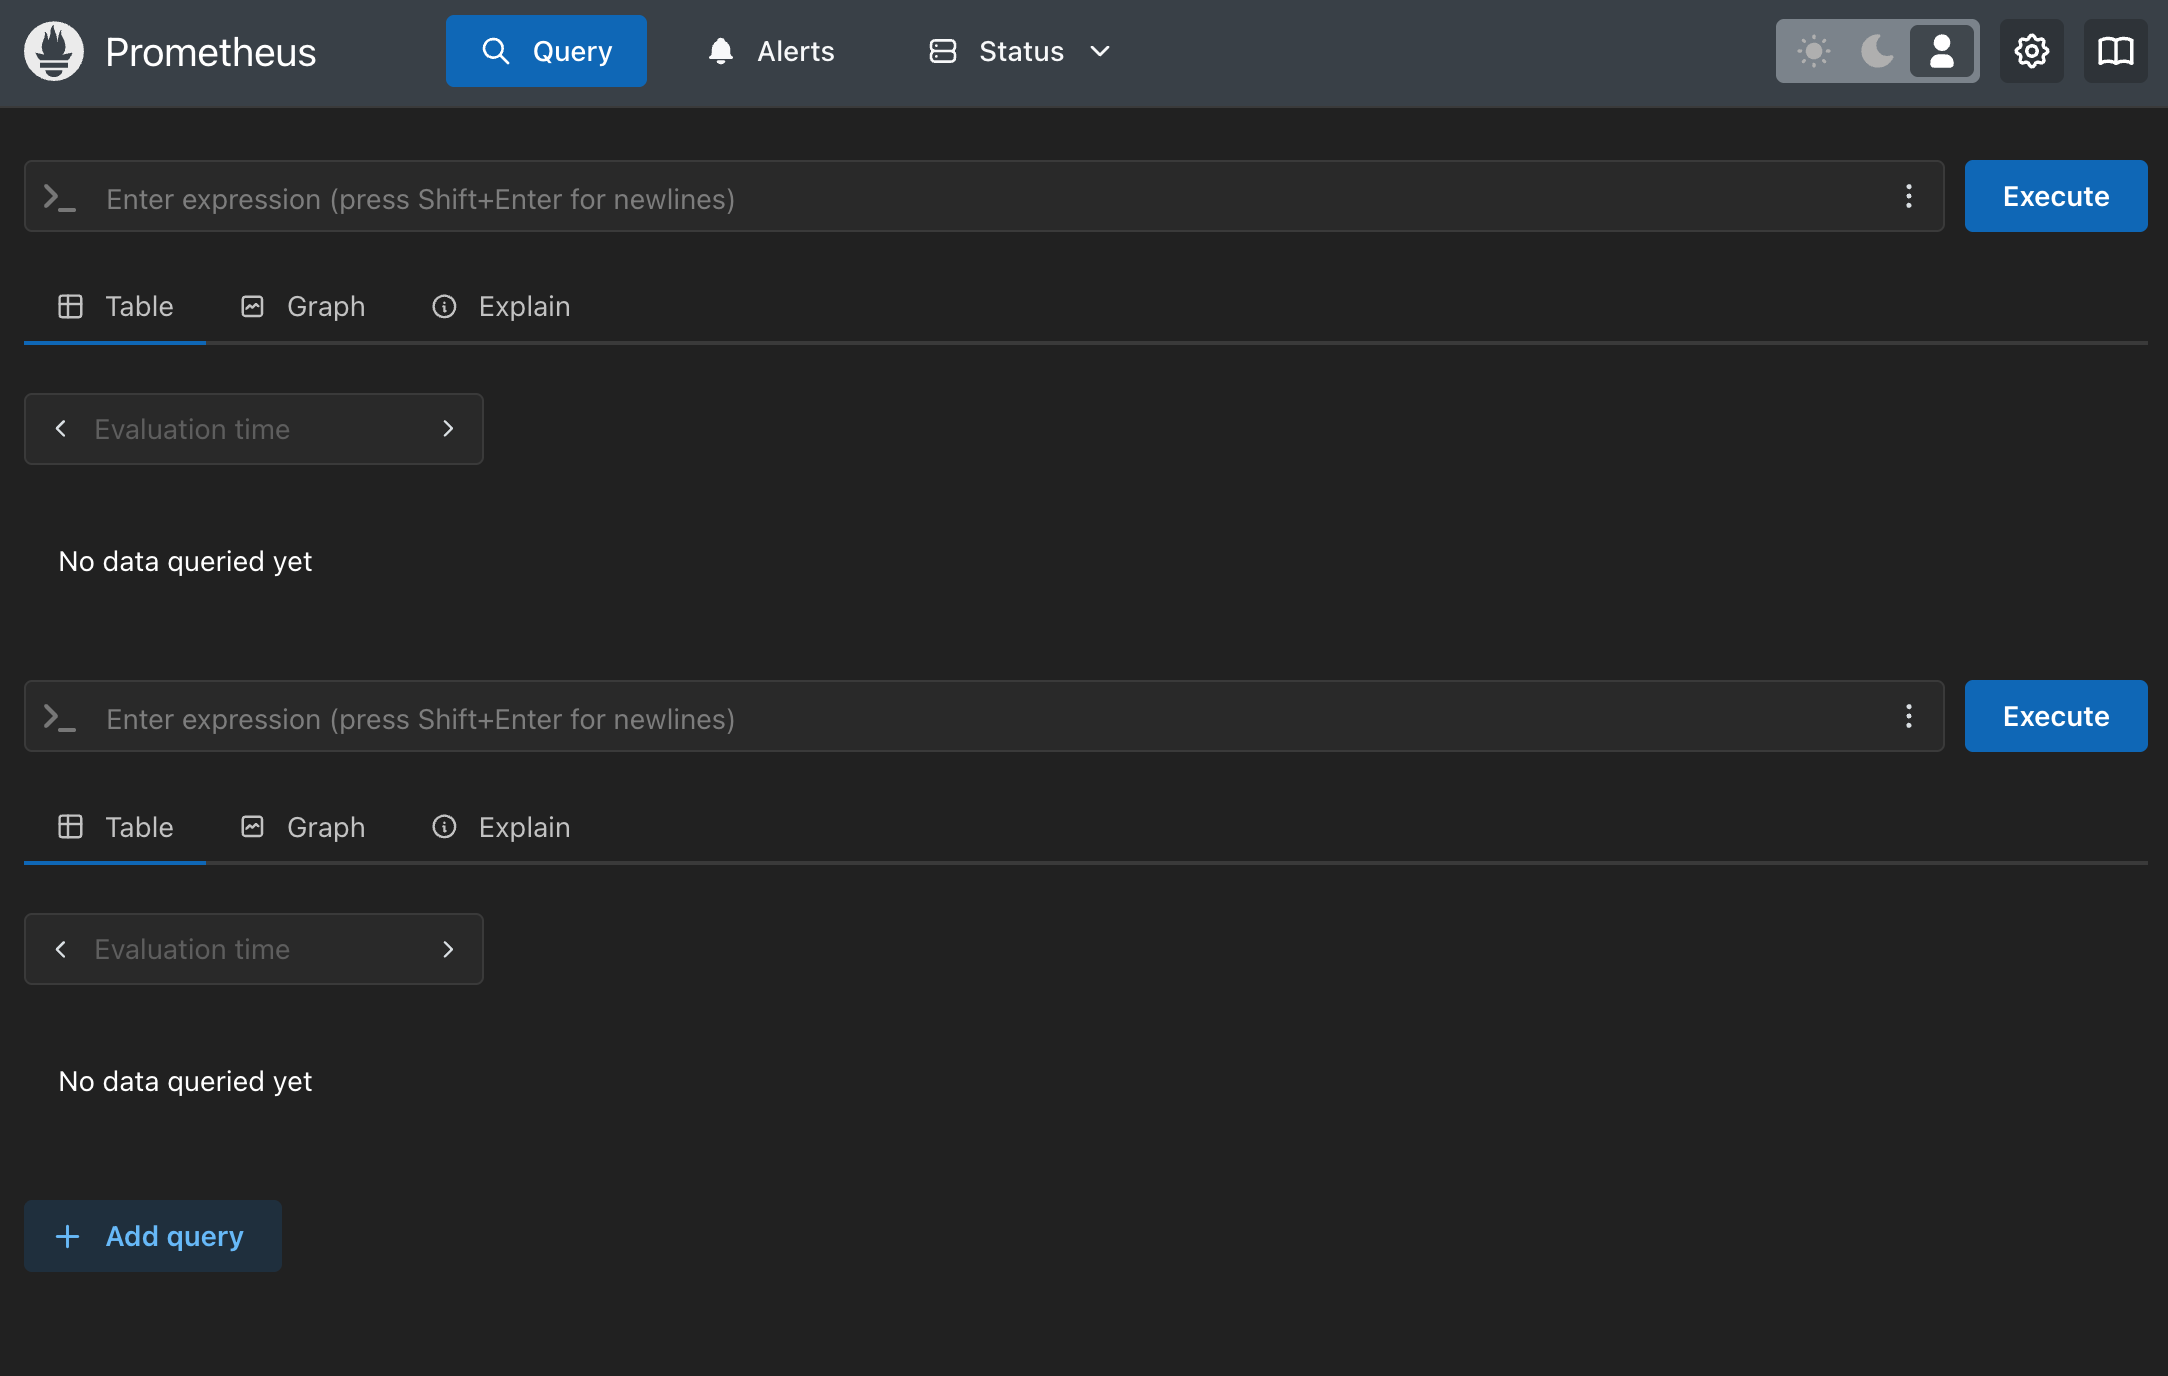
Find your load balancer URL on the Dataplane Settings page (Settings → Dataplane Settings → Monitoring section). To access the Prometheus server, open <load-balancer-url>/prometheus/query in your browser.
This works only from within your VPC — see access modes above. Prometheus is not available over the public dp-apps.cloud.onehouse.ai URL.
Prometheus is an open source time series database containing metrics about your Onehouse project and resources. You can query metrics directly in your browser with the prometheus console.
Grafana
Find your load balancer URL on the Dataplane Settings page (Settings → Dataplane Settings → Monitoring section). To access the Grafana server, open <load-balancer-url>/grafana in your browser.
Grafana is available in both access modes. If public access is enabled for your project, the URL is https://dp-apps.cloud.onehouse.ai/grafana.
Grafana is an open source observability tool that can build charts and alerts from the prometheus metrics in your Onehouse project. Onehouse pre-creates useful Grafana charts out-of-the-box.
Pre-built Grafana charts
You can also pull the Prometheus metrics into a self-managed Grafana instance within your environment.
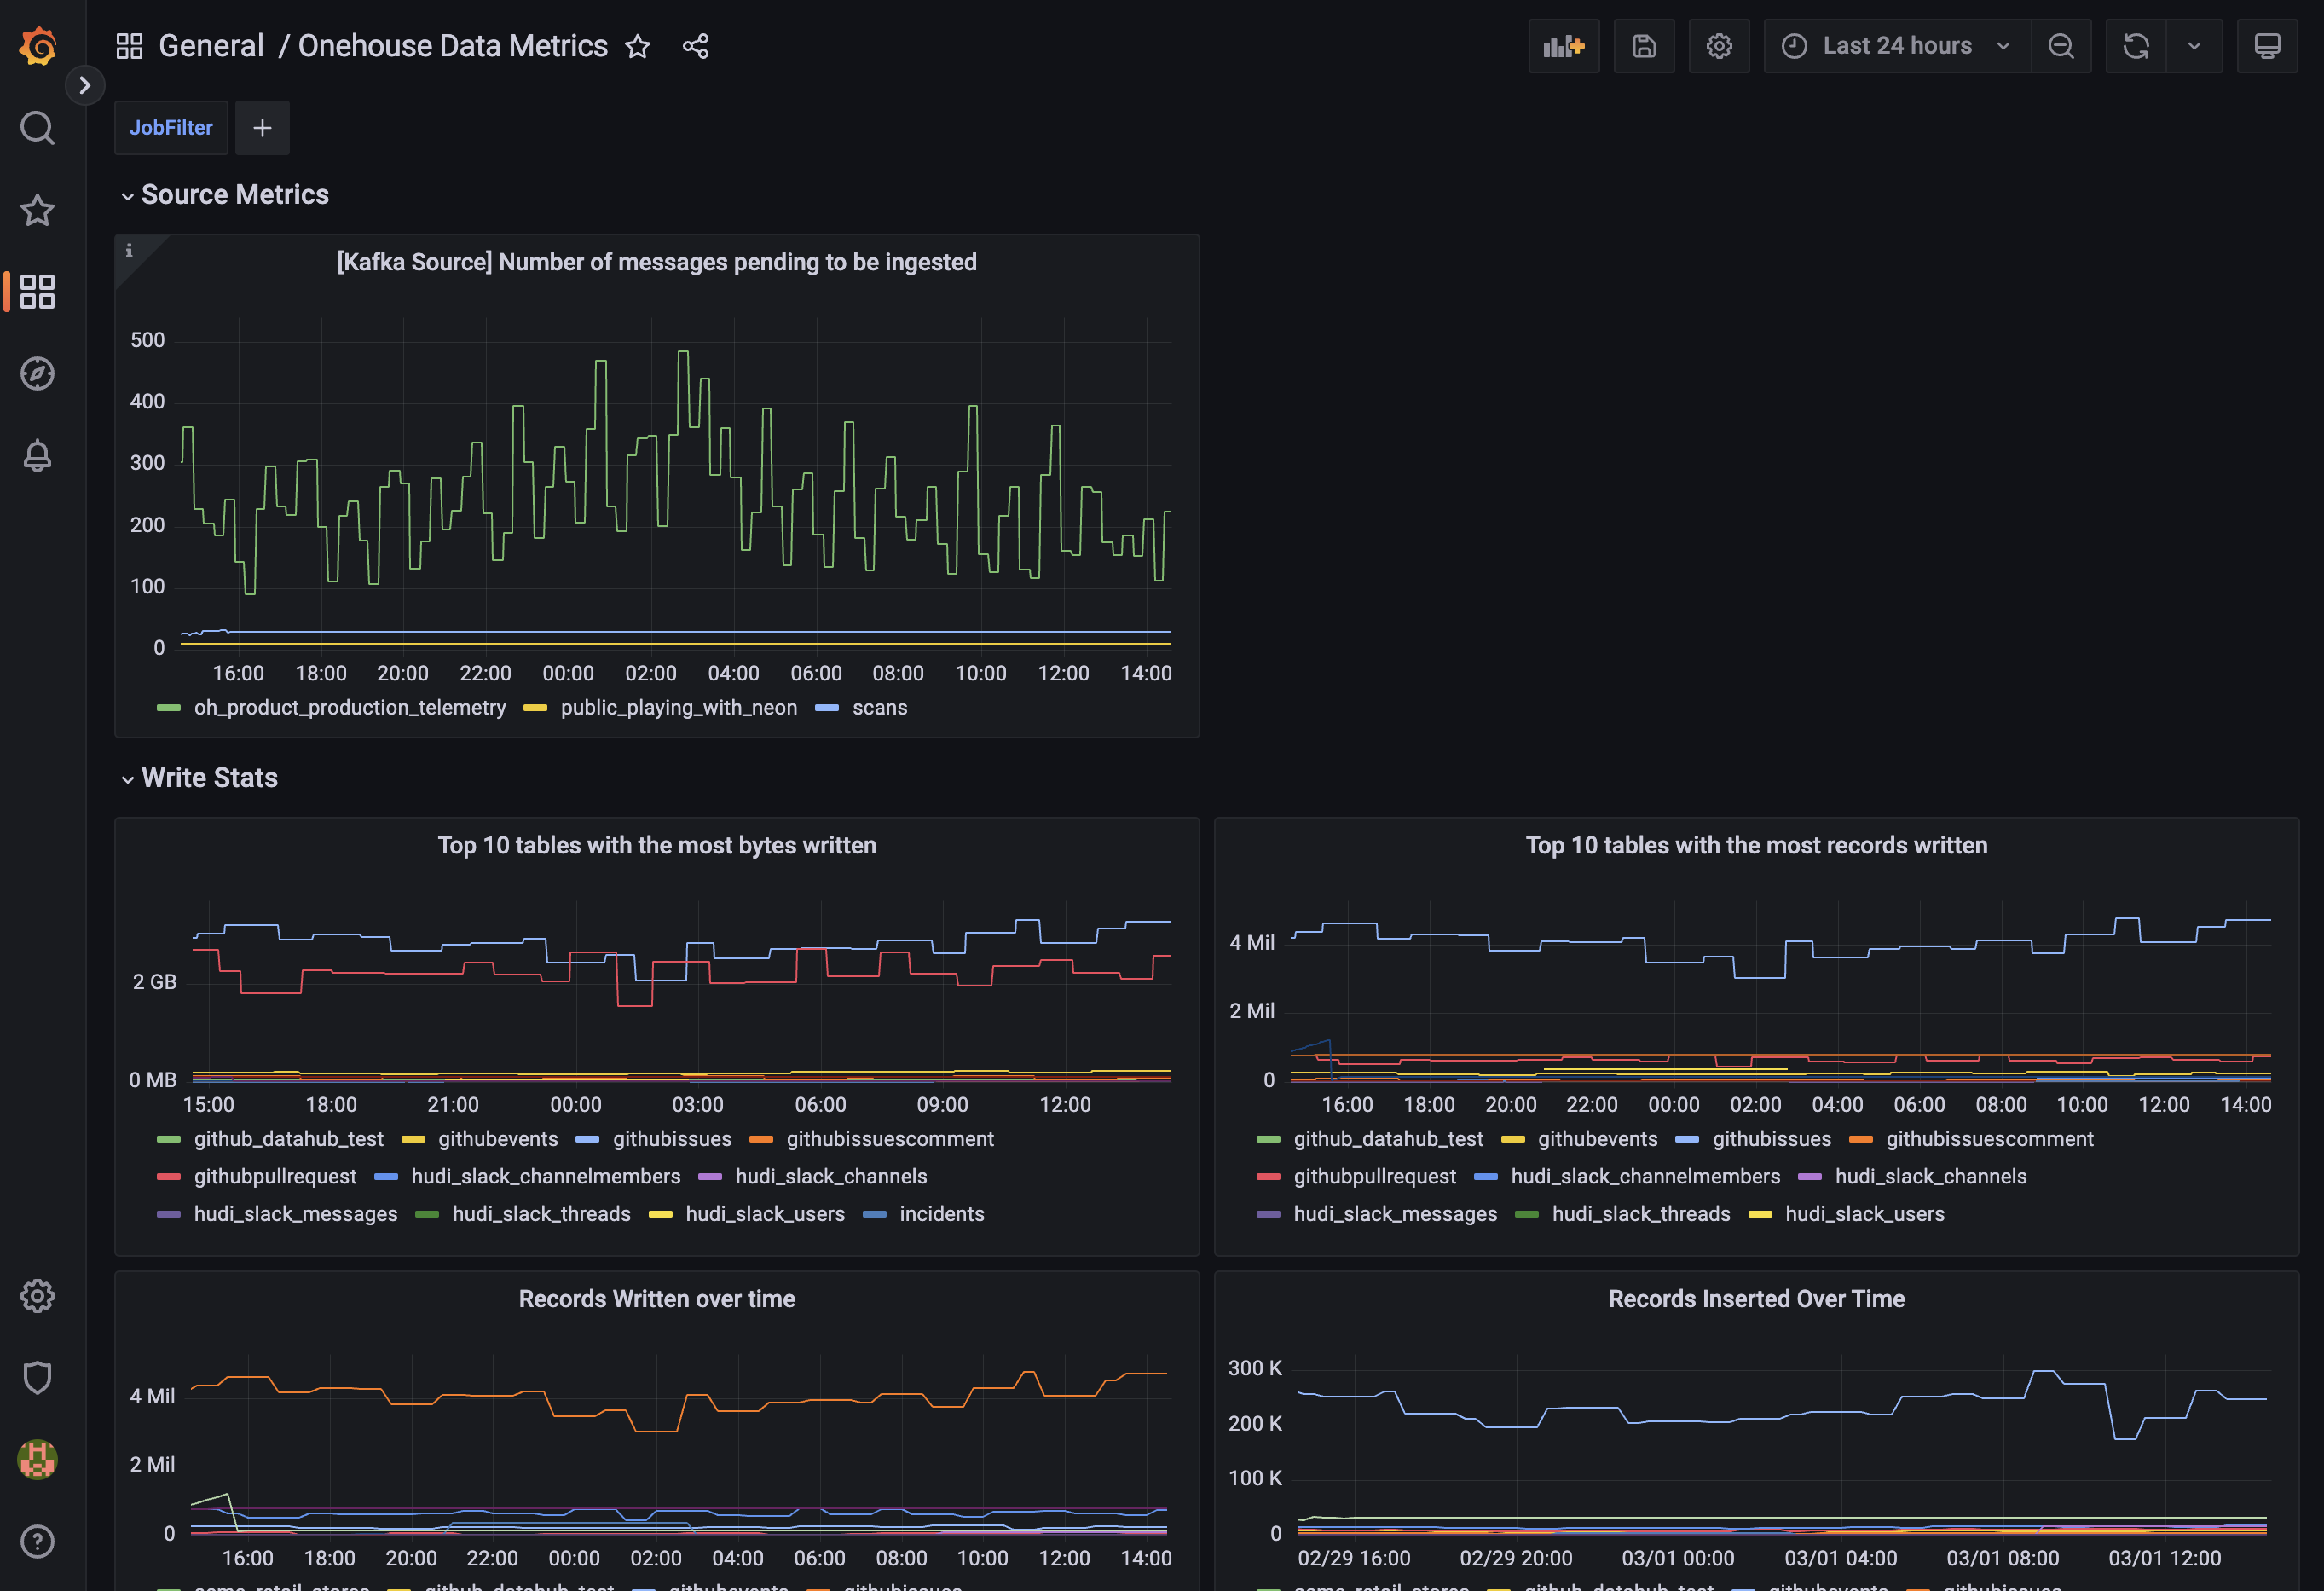
Onehouse will provides a Grafana with useful charts out-of-the-box. In the Grafana dashboard, you will find charts for the following use cases.
Configure Grafana Alerts
You can also configure custom Grafana alerts that are triggered by your Onehouse metrics. Follow these Grafana docs to configure alerts.
Get started with the following alert query templates:
- Alert on >3 consecutive lags for a stream
Or to exclude a table:
sum by(table, database) (ohds_deltastreamer_numConsecutiveSyncLags) > 3You can exclude multiple databases or tables by usingsum by(table, database) (ohds_deltastreamer_numConsecutiveSyncLags{database!="database_name", table!="table_name"}) > 3|to separate the different values - Alert when an in-progress sync is taking >3x longer than the configured sync frequency
(sum by(table, database) (ohds_deltastreamer_syncDurationSecs))/(sum by(table, database) (ohds_deltastreamer_syncIntervalSecs)) > 3
Build your own dashboards
The pre-built dashboards cover the most common cases. To build your own, see Spark Job Metrics for driver and executor metrics, and the Datadog Metrics Reference for ingestion and table-service metrics — both families are queryable from the same Prometheus.
Use Cases
Write Stats
Monitor write operations across your Flows and Tables. Charts included:
- Tables with Most Bytes Written: Top tables by bytes written, including write amplification.
- Tables with Most Records Written: Tables with most records written, including record inserts, updates, and deletes.
- Total Bytes Written: Total bytes written, including write amplification.
- Records Written over Time: Records written, including inserts, updates, and deletes.
- Records Inserted over Time: Records written, filtered to inserts.
- Records Upserted over Time: Records written, filtered to upserts. Note that a single record may have multiple upserts.
- Records Deleted over Time: Records written, filtered to deletes.
Lag Monitoring
Monitor the lag of write operations. Charts included:
- Data Pending to be Ingested (from Kafka source): Volume of Kafka messages in the source topic that have NOT been ingested yet.
- Sync Duration vs. Configured Sync Frequency: Sync Duration refers to the full time for a sync to process all data remaining in the source (including reading, writing, and syncing data to the catalog). Sync Frequency is the minimum interval for the Flow to trigger each sync. If Sync Duration is greater then the Sync Frequency, the Flow may be delayed.
- Flows with Longest Sync Durations: Sync Duration refers to the full time for a sync to process all data remaining in the source (including reading, writing, and syncing data to the catalog). Filtered to the top 10 Flows by Sync Duration.
- Number of Consecutive Sync Lags: Describes how many syncs in a row the Sync Duration was greater than the configured Sync Frequency for a Flow.
- Absolute Time of the Last Sync: Sync Duration for the last Flow sync.
- Number of Sync Failures: Describes how many syncs failed for a Flow. Note that Flows will retry a sync upon failure, then will move to the Failed state after several failed attempts.
Table Services Monitoring
Monitor table service runs. Charts included:
- Compaction, Clustering, and Cleaning Duration for All Tables: Duration of each table's most recent run of the Compaction, Clustering, or Cleaning service.
- Compaction, Clustering, and Cleaning Duration for Top Tables: Duration of each table's most recent run of the Compaction, Clustering, or Cleaning service. Filtered to the top 10 tables by duration.
- Bytes Written by Compaction and Clustering Commits: Data volume written in each table's most recent run of the Compaction or Clustering service.
- Number of Partitions Touched by Compaction and Clustering Commits: Partitions with at least one write in each table's most recent run of the Compaction or Clustering service. Large numbers may indicate an inefficient partitioning scheme.
- Number of Files Deleted by Cleaning: Files deleted in each table's most recent run of the Cleaning service.
OCU Usage
This dashboard provides a breakdown of the OCU usage across all Flows and Table Services.
Charts included:
- OCU Usage Per Resource: Percentage of OCU used by each Flow and Table Service.
- If you have S3 or GCS sources, you will see a "metadata" job in the chart. Onehouse deploys one metadata job per bucket to monitor new files to be ingested.
- OCU Usage Per Operation Type: Aggregate OCU usage breakdown by table service type.