Forward Telemetry to Your Own Tools
Overview
Onehouse can export your deployment's metrics and your Spark logs to observability tools you already run, so Onehouse telemetry sits alongside the rest of your stack instead of in a separate console.
Each destination is configured as an exporter. You can run several at once — for example Grafana Cloud for metrics and Splunk for logs — and each exporter carries its own credential, its own filters, and its own enable/disable switch.
This page covers what is common to every exporter. For the values a specific vendor needs, follow its page.
Supported destinations
| Destination | Signal | Authentication | Setup guide |
|---|---|---|---|
| Honeycomb | Metrics | Secret | Honeycomb |
| Datadog | Metrics | Secret | Datadog |
| Grafana Cloud | Metrics | Secret | Grafana Cloud |
| Splunk Enterprise | Logs | Secret (HEC token) | Splunk Enterprise |
| AWS S3 | Logs | IAM — no secret | Spark Log Forwarding |
| Azure Blob Storage | Logs | Managed identity — no secret | Spark Log Forwarding |
A destination handles either metrics or logs, never both. The Signals field in the dialog is greyed out because the vendor determines it — you cannot change it.
Vendors are enabled per org. If one you want is missing from the dropdown, contact Onehouse (or your account team) to have it turned on.
How it works
Metrics and logs travel on two independent pipelines inside your data plane:
Metrics:  Onehouse + Spark metrics → OpenTelemetry Collector → your metrics vendor

Logs:     Spark driver + executors → Fluent Bit (per node) → Vector logs gateway → your log vendors
They are deployed separately on purpose: a spike in log volume, or an outage at one log vendor, cannot delay or drop metrics delivery, and vice versa. Each pipeline fans out to every enabled exporter independently, so one failing destination does not affect the others.
Both pipelines run inside your own data plane — telemetry goes directly from your cloud account to your vendor, and is not routed through Onehouse.
Before you begin
- The vendor must be enabled for your org, otherwise it does not appear in the Vendor dropdown.
- Outbound network access to the vendor's endpoint must be permitted from your data plane. If your VPC uses an egress firewall with domain or SNI filtering, add the vendor's domain to the allowlist — otherwise exports fail silently at the network layer, with no error in the Onehouse console. Each vendor page names the domain it needs; see also the egress requirements in the data plane prerequisites.
- Know which secret model your org uses — see below.
Where your credential is stored
How you supply a vendor credential depends on how your data plane was deployed. You do not choose this per exporter; the console shows the right field automatically.
| Model | What you do | What you see in the dialog |
|---|---|---|
| Onehouse-managed secrets (OMS) | Nothing — Onehouse provisions and stores the credential for you | No secret field |
| Bring-your-own-secret (BYOS) | Store the credential in your own secret manager and paste its reference | A required Secret Reference field |
BYOS is enabled by setting enableTelemetryByos in your customer stack configuration — see the customer stack reference. The secret must also be tagged accessibleTo=onehouse so the data plane can read it.
In the exporter list, a BYOS credential is shown as its reference, prefixed Customer-managed (BYOS). The secret value itself is never displayed.
AWS S3 and Azure Blob Storage authenticate with the data plane's own cloud identity — its IAM role on AWS, its managed identity on Azure — so they have no credential at all: nothing to enter, store, or rotate, under either model.
Find the Observability settings
In the Onehouse console, go to Settings ▸ Integrations. The Observability card is where all telemetry exporters live — click Manage.
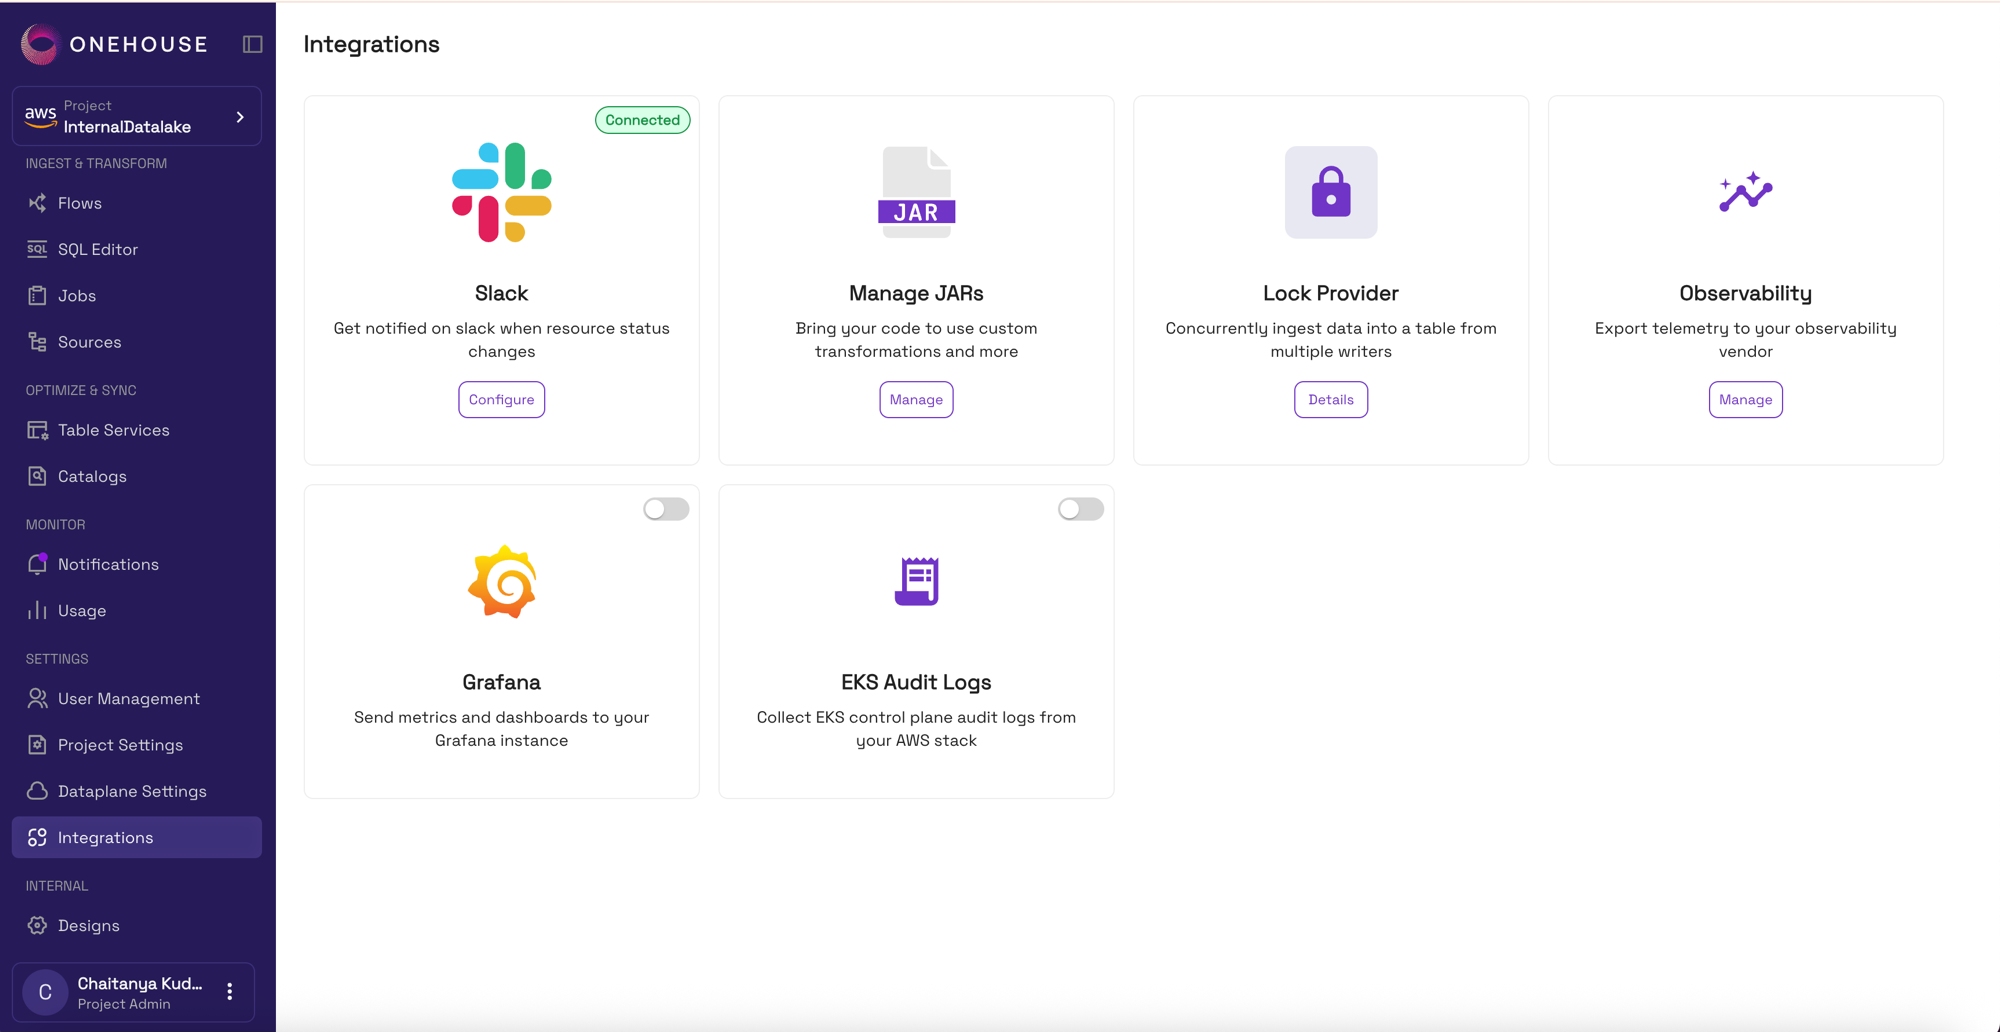
This page also carries two standalone integrations that are simple on/off switches rather than exporters: Grafana, which sends metrics and dashboards to your own Grafana instance, and EKS Audit Logs, which collects EKS control-plane audit logs from your AWS stack.
The exporter list
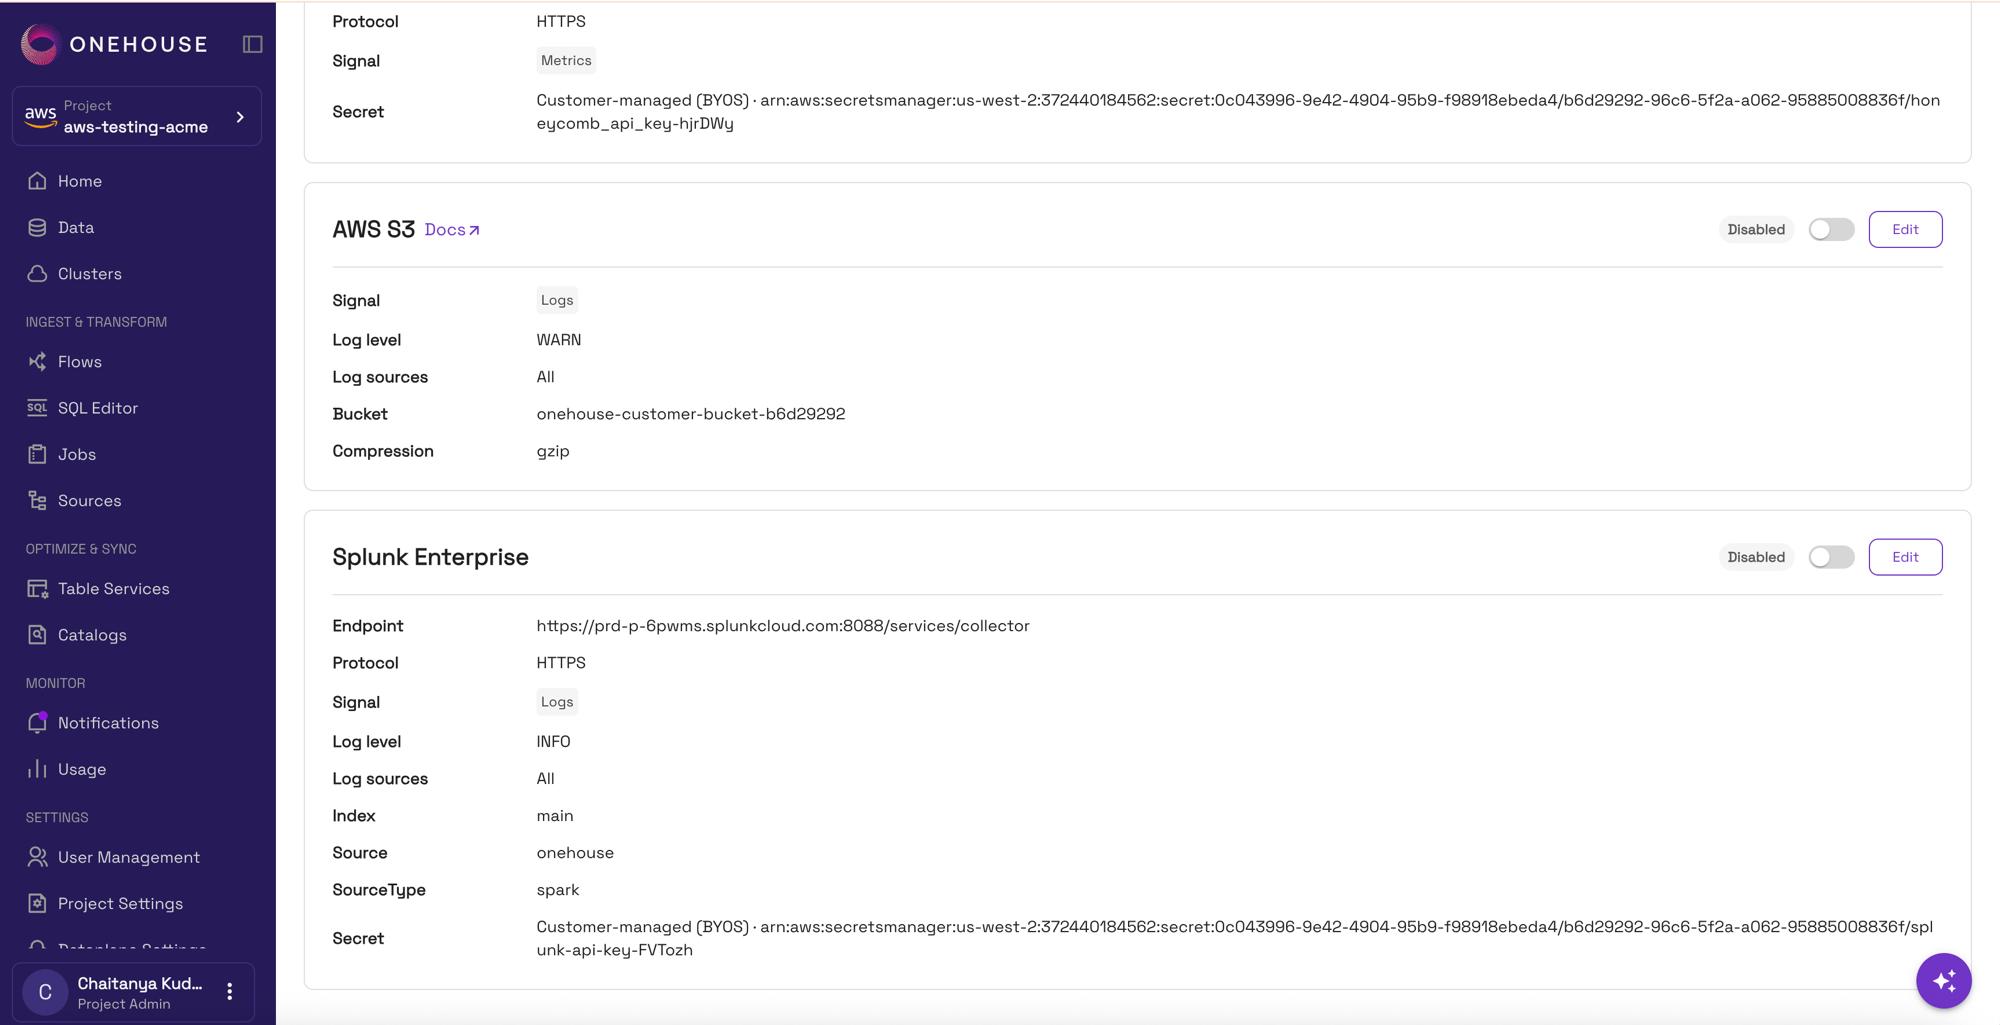
The Observability page lists every exporter configured for your project, each showing its current settings at a glance.
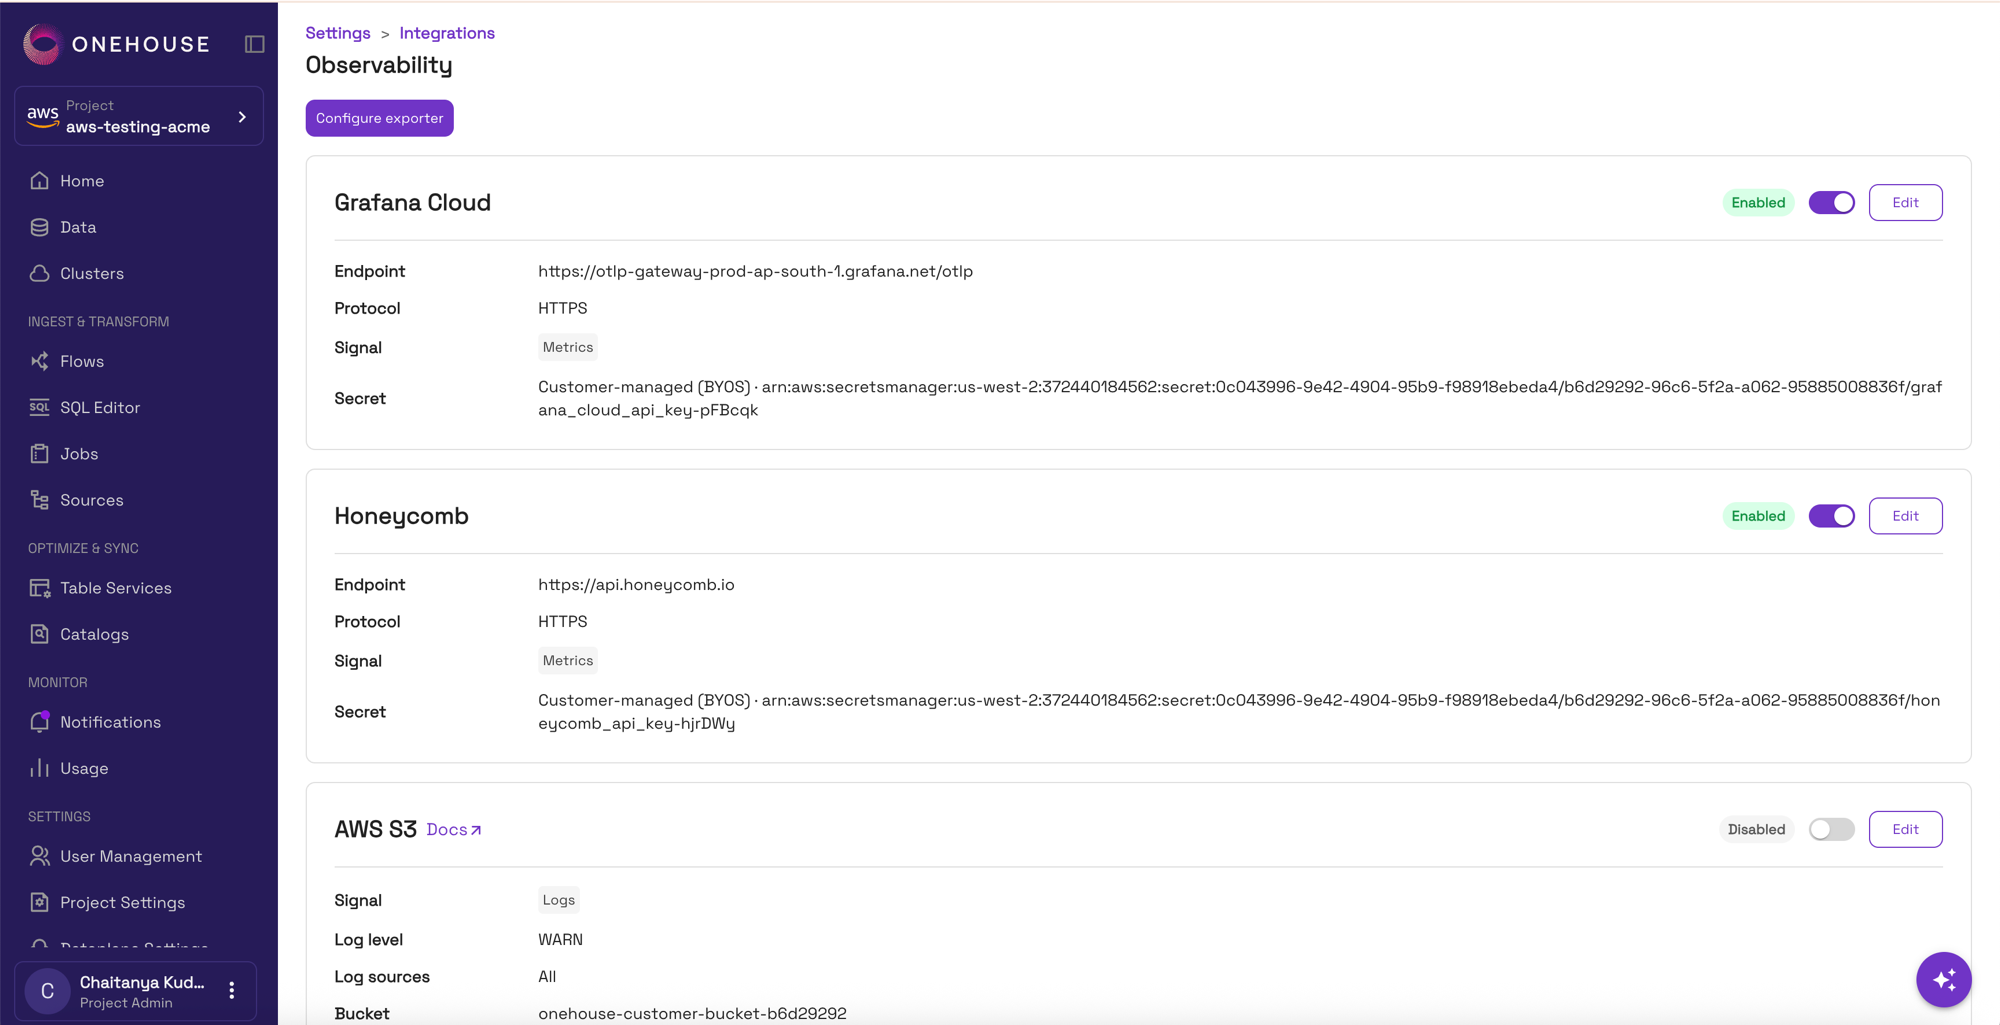
Each exporter card gives you:
- A status pill and toggle —
EnabledorDisabled. The toggle starts and stops export without deleting the configuration, so you can pause a destination and resume it later with its settings intact. - Edit — reopens the configuration dialog.
- A summary of the current settings, which differs by signal. Metrics exporters show endpoint, protocol, signal, and secret; log exporters additionally show log level, log sources, and any vendor-specific routing.
Add an exporter
-
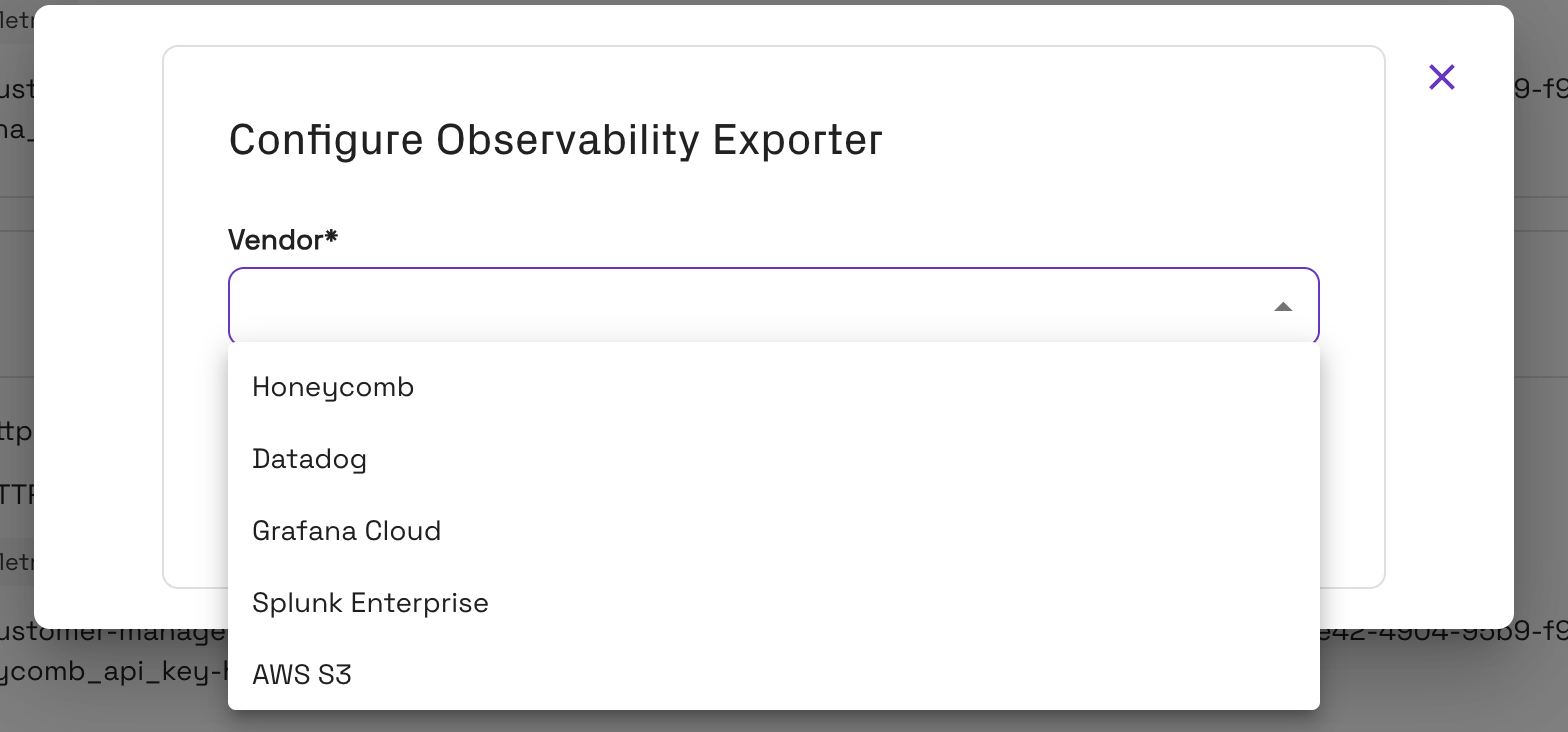
On the Observability page, click Configure exporter.
-
Pick your vendor from the Vendor dropdown. Only vendors enabled for your org appear here.
-
Fill in the fields the vendor requires. They vary — an endpoint-based vendor asks for Endpoint and Protocol, while one that uses the data plane's cloud identity, such as AWS S3 or Azure Blob Storage, asks for neither.
-
Signals is always greyed out. It is set by the vendor.
-
For log destinations, set Minimum log level and Log sources (see below), plus any optional vendor-specific routing.
-
If your org uses BYOS, paste your Secret Reference.
-
Click Submit.
The exporter appears in the list. Use its toggle to enable it, and telemetry begins flowing within a few minutes.
Log forwarding options
Every log destination shares two filters. Both are set per exporter, so you can send WARN and above to one vendor while another receives only errors.
Minimum log level
| Value | Forwards |
|---|---|
INFO | INFO, WARN, ERROR |
WARN (default) | WARN, ERROR |
ERROR | ERROR only |
The dialog describes each level as you select it — WARN, for example, reads "Medium verbosity, filters for & relays both error and warning logs".
Three behaviours are worth knowing before you choose:
Executor logs are always forwarded at WARN and above, regardless of this setting. Selecting INFO adds INFO-level driver logs; executor volume does not change.
The per-node collector forwards a single driver-log stream, filtered at the most permissive level any enabled log exporter requests. Each exporter's own filter is then applied when logs fan out, so every destination still receives exactly the level you chose for it.
The practical effect: setting one exporter to INFO makes the collector ship INFO-level driver logs cluster-wide, raising collector CPU and network use even though your other vendors never see those lines. If you only need INFO while debugging, set it back afterwards.
Filtering is fail-open. A log line Onehouse cannot classify is forwarded rather than dropped, so an unlevelled line reaches your vendor even at ERROR.
Log sources
| Value | Forwards |
|---|---|
All (default) | Driver and executor logs |
Driver | Driver logs only |
Executor | Executor logs only |
As with levels, this is fail-open: a log line that cannot be attributed to a driver or an executor is forwarded regardless of the selection.
Edit, pause, or rotate
- Change settings — click Edit on the exporter, adjust, and Submit.
- Pause export — switch the toggle to
Disabled. The configuration is retained; flip it back to resume. - Rotate a credential — under BYOS, update the value of the secret in your own secret manager. The reference does not change, so there is nothing to edit in Onehouse. Under OMS, contact Onehouse.
Troubleshooting
| Symptom | Likely cause |
|---|---|
| The vendor is missing from the dropdown | It has not been enabled for your org. Contact Onehouse. |
| The endpoint is rejected in the dialog | The URL does not match the shape the vendor expects. Check the vendor's page, and use the greyed placeholder text in the Endpoint field as a template. |
| Submit stays greyed out | A required field (marked *) is empty. Under BYOS, Secret Reference is required. |
| Nothing arrives, and no error appears in the console | The exporter is Disabled, the credential is wrong, or egress is blocked. Authentication and network failures are both silent. |
| Metrics arrive but logs do not, or the reverse | Expected — each destination carries one signal only. Check the Signal shown on the exporter card. |
| Logs arrive, but not at the level you expect | The level applies to driver logs only; executors are pinned at WARN and above. |
Related
- Advanced Monitoring — the Prometheus and Grafana stack Onehouse runs inside your data plane.
- Datadog Metrics Reference — the metric names and labels every metrics destination receives.
- Monitor Job Runs — Spark logs in the Onehouse console, without any export.