Splunk Enterprise
Overview
Onehouse can forward your Apache Spark driver and executor logs to Splunk Enterprise or Splunk Cloud Platform through the HTTP Event Collector (HEC), so Onehouse logs are searchable in Splunk alongside the rest of your operational data.
Logs travel directly from your data plane to your Splunk instance. Onehouse does not receive or relay them.
This integration targets Splunk Enterprise and Splunk Cloud Platform — the log-indexing products that expose a HEC endpoint. Splunk Observability Cloud (the SignalFx metrics product) is a different service and is not currently supported.
Before you start, read Forward Telemetry to Your Own Tools for the parts common to every exporter — where credentials live, how the log filters behave, and how to pause or rotate an exporter.
Before you begin
- Splunk Enterprise must be enabled for your org, or it will not appear in the Vendor dropdown. Contact Onehouse (or your account team) to turn it on.
- Your Splunk instance must be reachable from your data plane over HTTPS. Splunk Cloud Platform endpoints sit on
*.splunkcloud.com; if your VPC uses an egress firewall with domain or SNI filtering, add that domain — or your self-hosted Splunk host — to the allowlist. Blocked egress fails silently, with no error in the Onehouse console. - HEC must be enabled on your Splunk instance, with a token you can dedicate to Onehouse.
Collect your Splunk values
1. HEC endpoint
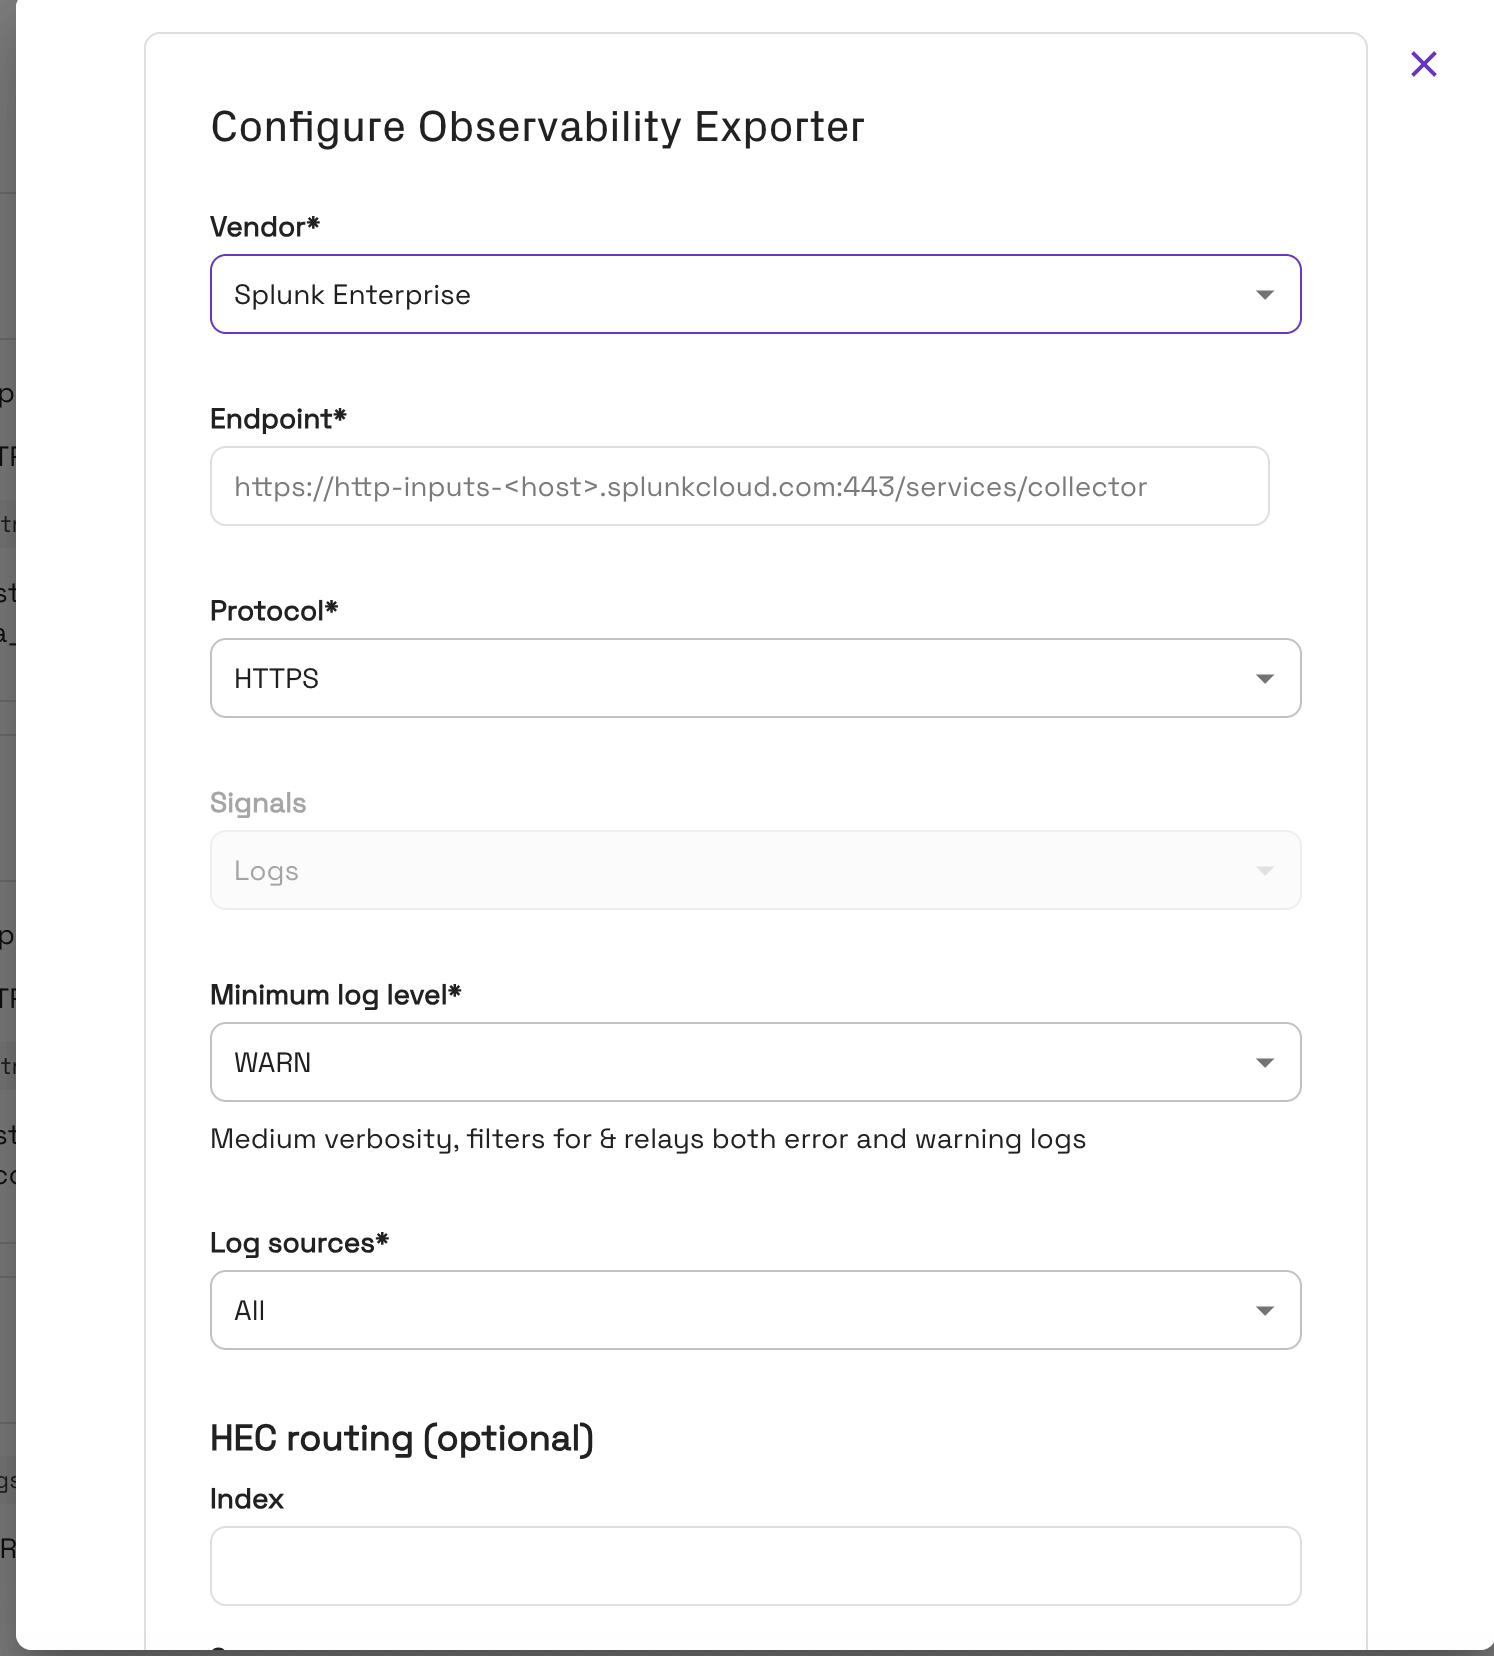
Onehouse expects the full HEC collector URL, including scheme, host, port, and the /services/collector path. The dialog's placeholder shows the shape:
https://http-inputs-<host>.splunkcloud.com:443/services/collector
| Splunk product | Typical endpoint |
|---|---|
| Splunk Cloud Platform | https://http-inputs-<stack>.splunkcloud.com:443/services/collector |
| Splunk Enterprise (self-managed) | https://<your-splunk-host>:8088/services/collector |
Splunk is HTTPS-only in Onehouse — an http:// endpoint is rejected in the dialog. If your self-managed HEC listener serves plain HTTP, enable TLS on it before configuring the exporter.
2. HEC token
In Splunk, go to Settings ▸ Data Inputs ▸ HTTP Event Collector and create a token dedicated to Onehouse — onehouse-spark-logs, for example. Copy the token value, a UUID such as a1b2c3d4-….
Two things to check while you are there:
- Note the index the token writes to. If you want Onehouse logs in a particular index, either set it as the token's default or enter it under HEC routing below.
- Confirm the token is enabled, and that HEC itself is enabled under Global Settings — a token on a disabled HEC accepts nothing.
Where the token goes depends on your org's secret model. Under BYOS, store it in your own secret manager and paste the reference into the exporter. Under OMS, Onehouse manages it for you and no secret field appears. See where your credential is stored.
Set up the exporter
-
Go to Settings ▸ Integrations, then Manage on the Observability card.
-
Click Configure exporter and select Splunk Enterprise as the Vendor.
-
Paste your HEC collector URL into Endpoint.
-
Protocol is HTTPS and Signals is greyed out at Logs — both are fixed by the vendor.
-
Set Minimum log level and Log sources.
-
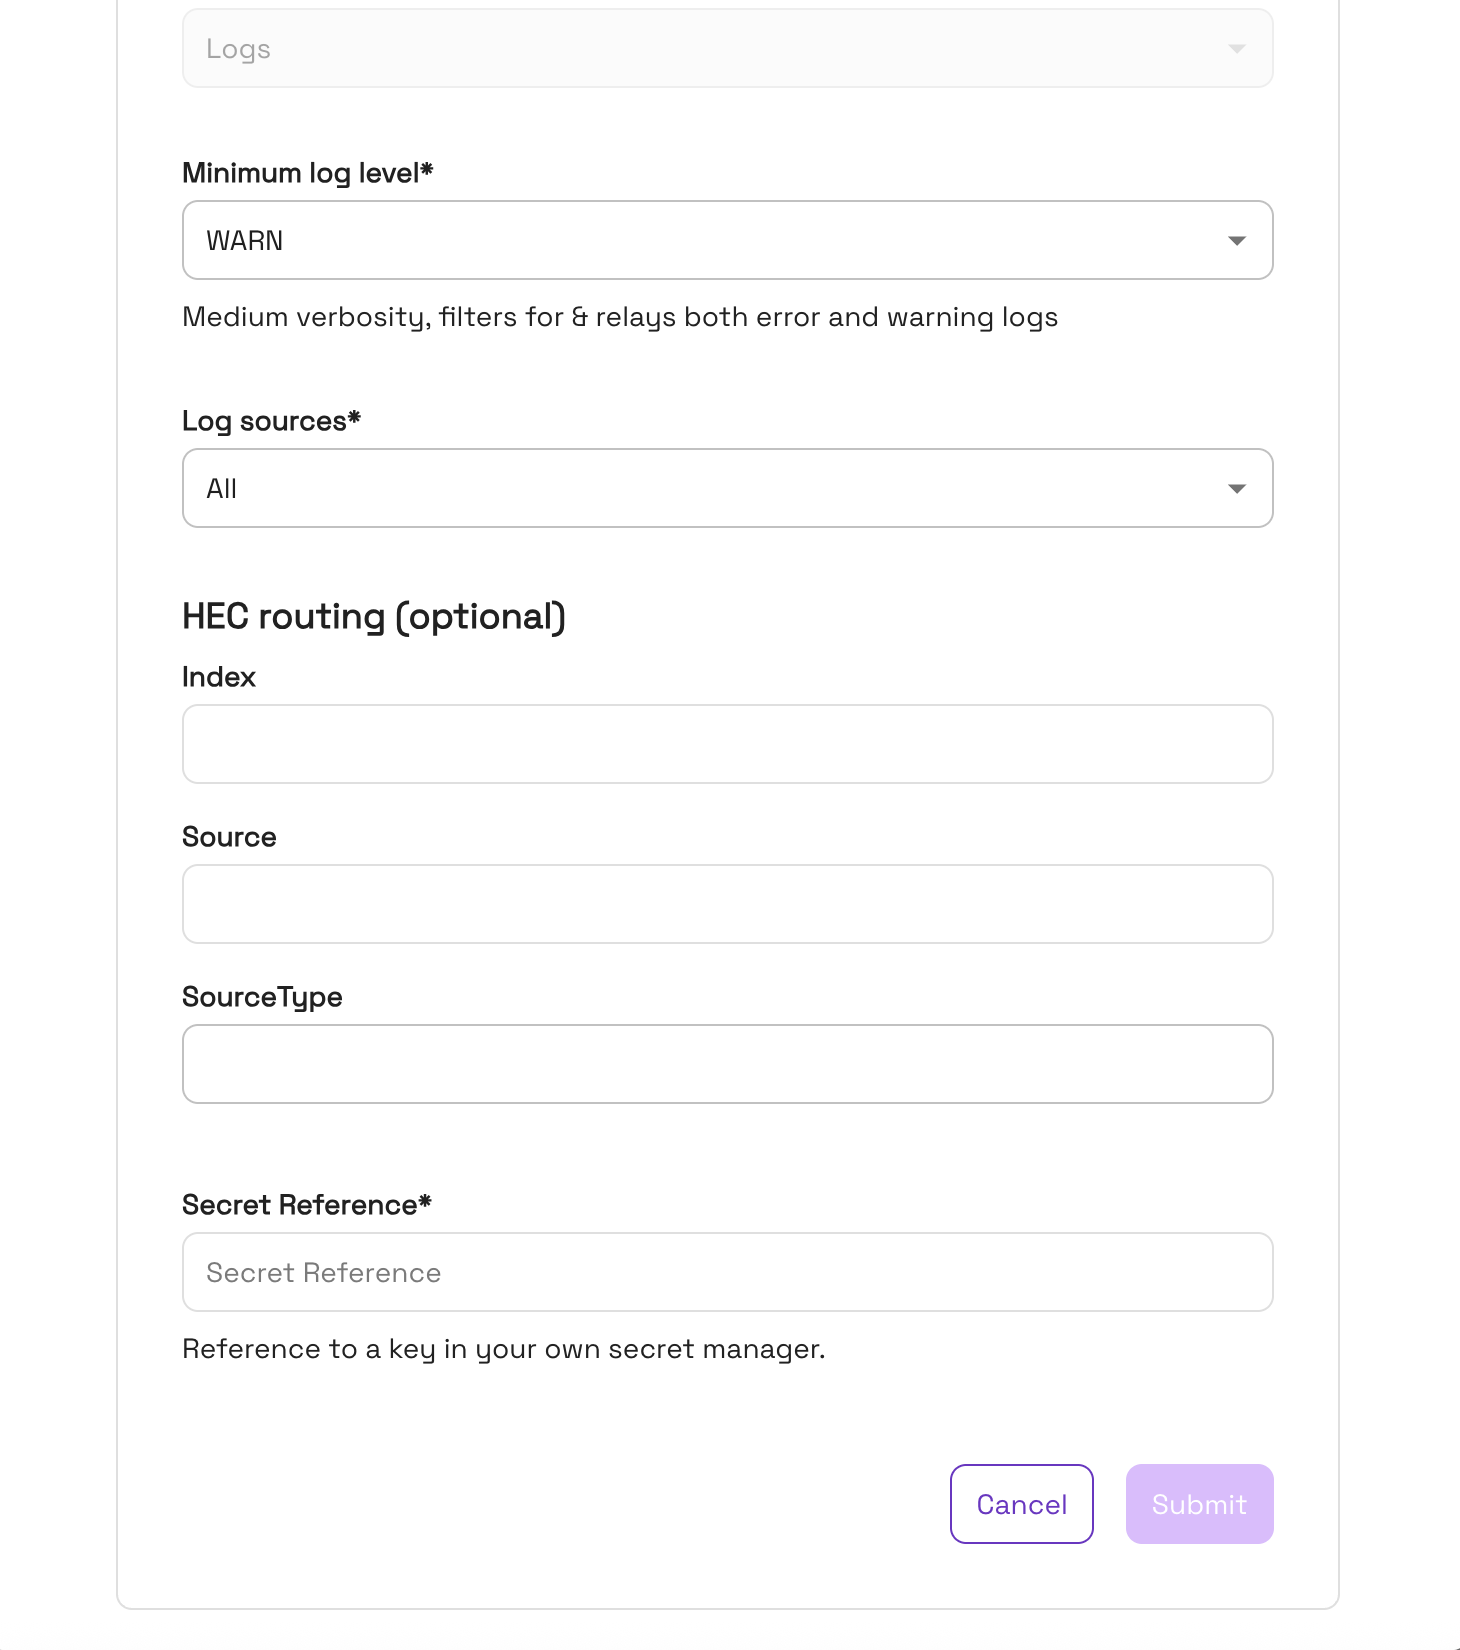
Optionally set the HEC routing fields, and — under BYOS — paste your Secret Reference.
-
Click Submit, then switch the exporter's toggle to Enabled.
Logs begin arriving within a few minutes.
Configuration options
| Field | Values | Default | Notes |
|---|---|---|---|
| Endpoint | HEC collector URL | — | Required. HTTPS only. |
| Protocol | HTTPS | HTTPS | Fixed by the vendor. |
| Signals | Logs | Logs | Fixed by the vendor; the field is greyed out. |
| Minimum log level | ERROR, WARN, INFO | WARN | Applies to driver logs. Executor logs are always forwarded at WARN and above. See minimum log level. |
| Log sources | Driver, Executor, All | All | Which Spark sources to forward. |
| Index | Any index name | (token default) | Under HEC routing. Leave blank to use the index configured on the HEC token. |
| Source | Any string | (unset) | Under HEC routing. Sets Splunk's source field. |
| SourceType | Any string | (unset) | Under HEC routing. Sets Splunk's sourcetype field. Leave blank to let Splunk apply its own detection. |
| Secret Reference | Reference in your secret manager | — | BYOS orgs only; required when shown. |
All three routing fields can be left blank — Splunk then applies the token's default index and its own source/sourcetype handling. Set them when you want Onehouse logs isolated in a dedicated index, or tagged distinctly for existing Splunk searches and dashboards. Common values are onehouse for Source and spark for SourceType.
Verify logs are arriving
Run a Job (or wait for a scheduled one), then search in Splunk:
index=<your-index> earliest=-15m
If you set a SourceType, narrow it:
index=<your-index> sourcetype=<your-sourcetype> earliest=-15m
The default level is WARN, so a clean Job run may legitimately produce nothing. To confirm the path end to end, either set the level to INFO temporarily, or search a window covering a run you know logged warnings.
Troubleshooting
| Symptom | Likely cause |
|---|---|
| Endpoint rejected in the dialog | The URL is not HTTPS, or is not a valid host. Splunk is HTTPS-only here. |
| Submit greyed out | A required field is empty — under BYOS that includes Secret Reference. |
| No events in Splunk, no console error | An invalid or disabled HEC token, HEC disabled globally on the instance, or egress blocking your Splunk host. All three fail silently. |
403 or 401 at Splunk | The token is wrong, disabled, or deleted. Create a new one and update your secret's value. |
| Events land in the wrong index | Index is blank, so the token's default index applies. Set it explicitly on the exporter or on the token. |
| Only warnings and errors arrive | Expected at the default WARN. Set Minimum log level to INFO for more. |
| Driver INFO logs arrive but executor INFO logs do not | Expected. Executor logs are pinned to WARN and above. |
| Logs stopped after a working period | The exporter may have been toggled to Disabled, or the HEC token rotated at the Splunk end. |
Limitations
- Logs only — Onehouse metrics are not sent to Splunk. For metrics, use Honeycomb, Datadog, or Grafana Cloud.
- HTTPS only — plain HTTP HEC listeners are not supported.
- Splunk Observability Cloud is not supported — this integration is HEC-based.
- Executor log level is fixed at WARN and above and cannot be lowered.
- Delivery is best-effort. The logs gateway retries transient failures from an in-memory buffer, so a brief Splunk outage is absorbed, but a prolonged one can drop events. Run Spark Log Forwarding alongside Splunk if you need a durable archive.